Test report analysis
Overview
Overall view
Open the detailed html report after the performance test execution is finished; Your report can be analyzed by metrics, active users and requests/responses over time, as well as distributions
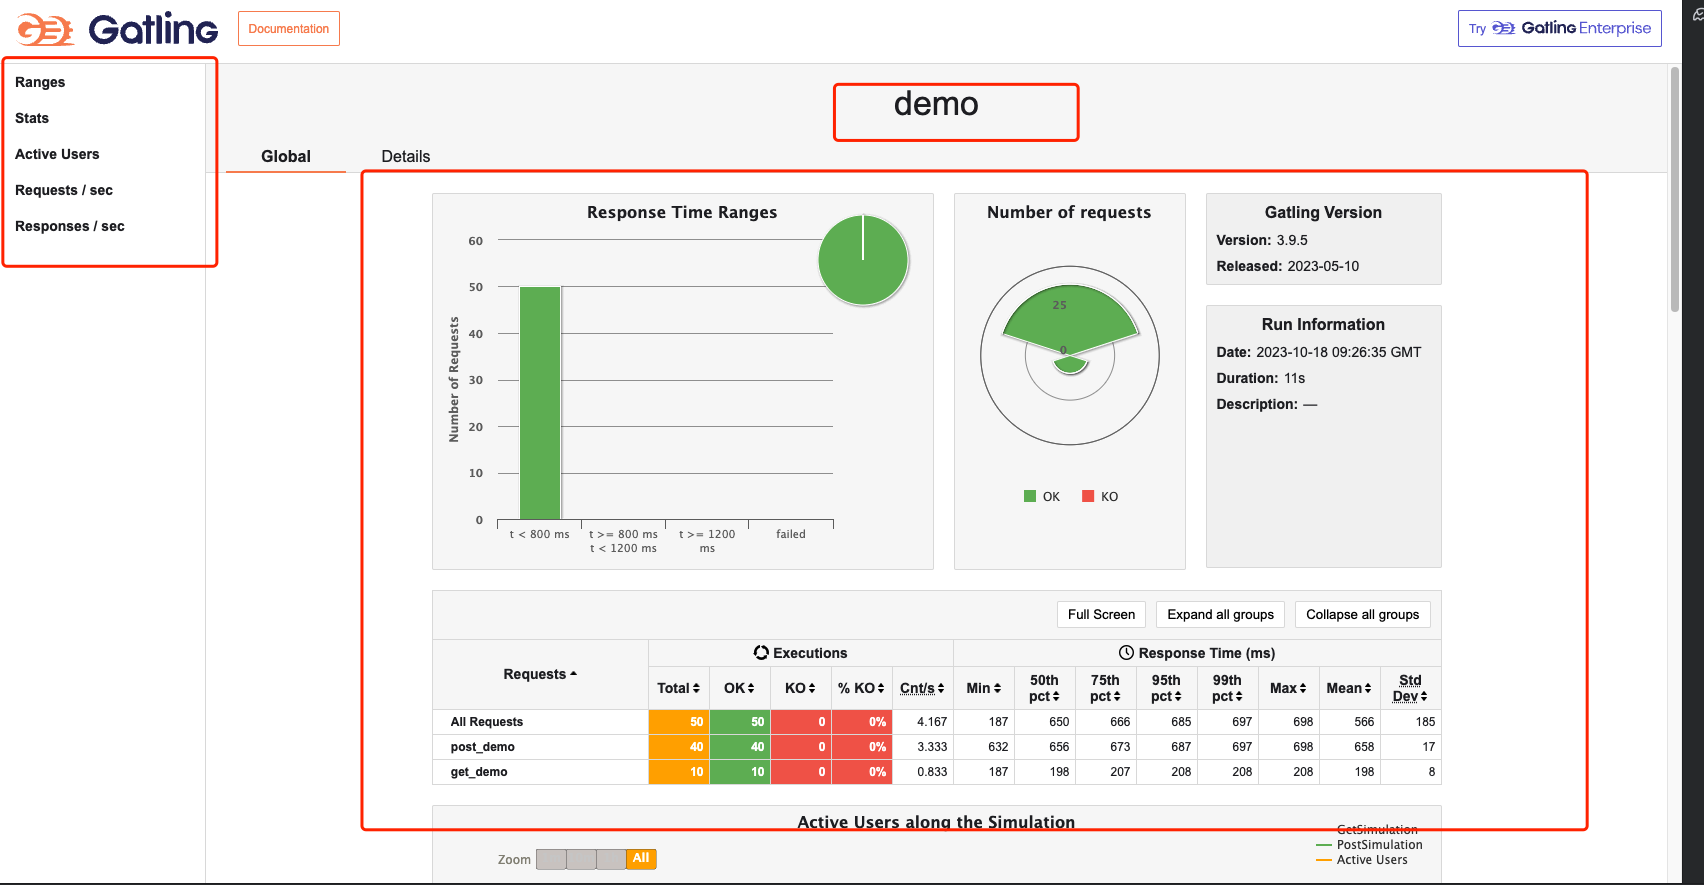
- The name of Simulation is displayed in the center of the page in the header
- The list on the left side shows a menu of different types of reports, which can be switched by clicking on them.
- The middle of the page shows an overview of the performance test report, including: total number of requests, total number of successful requests, total number of unsuccessful requests, shortest response time, longest response time, average response time, throughput, standard deviation, percentage distribution, etc. It also shows the version of gatling and the time and duration of this report. The version of gatling and the time and duration of this report run are also displayed.
- The Global menu points to aggregate statistics.
- The Details menu points to statistics for each request type.
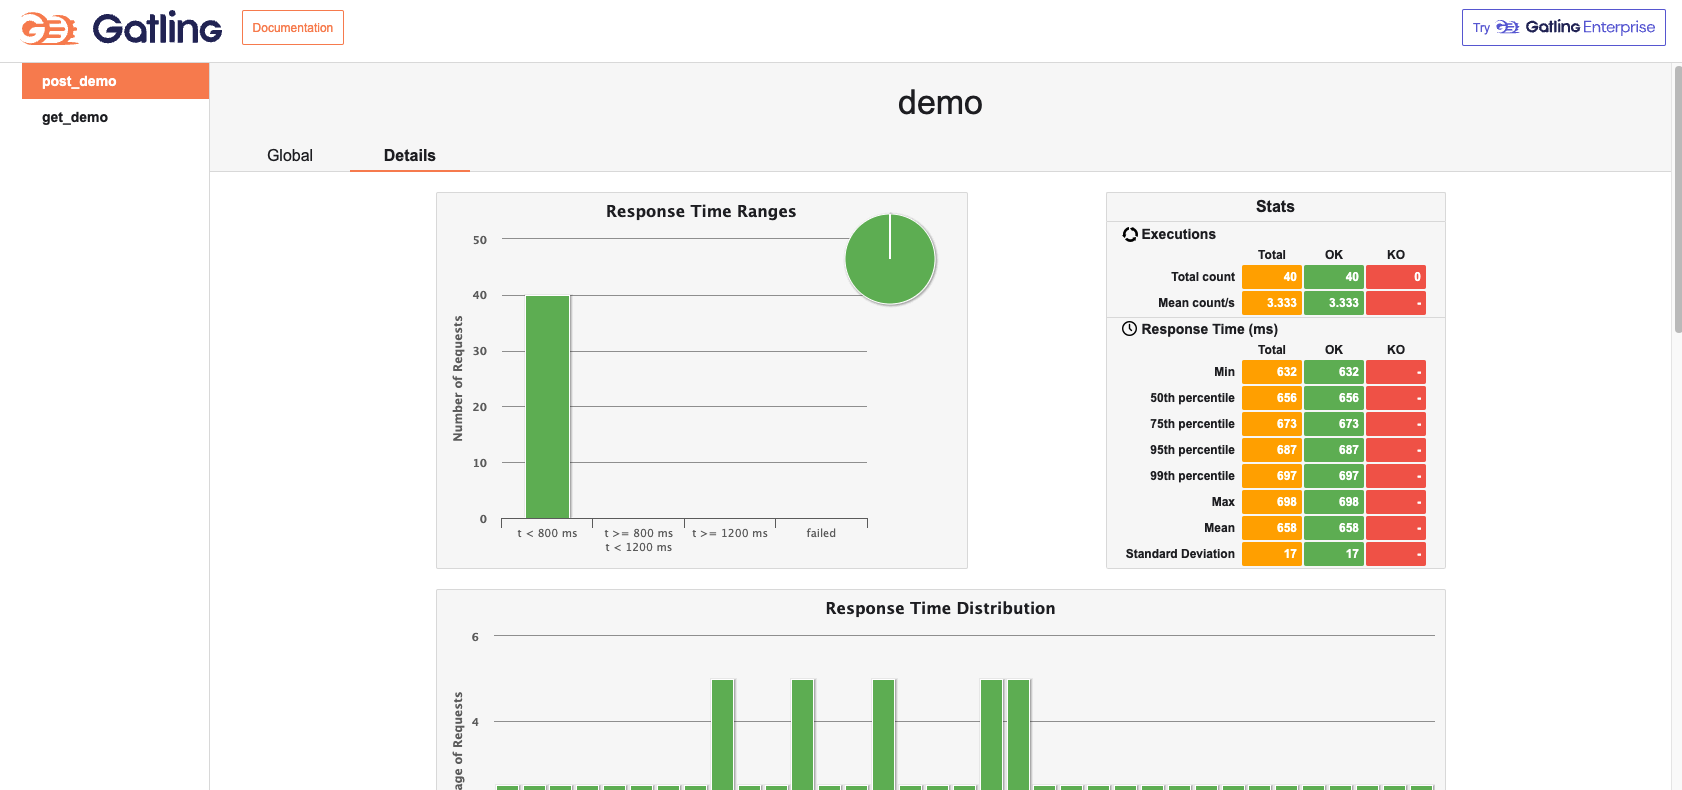
Response time ranges
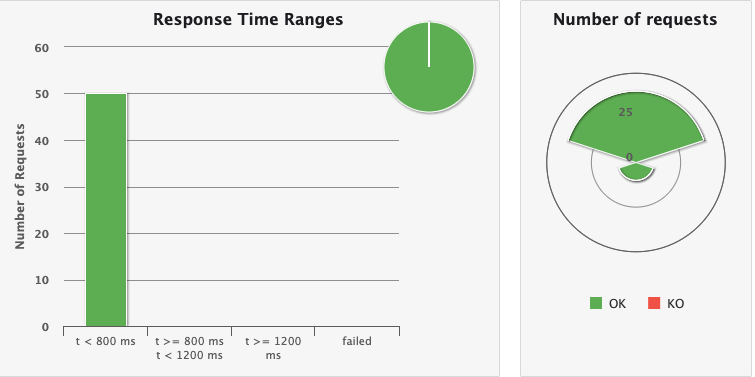
This chart shows the distribution of response times within the standard range The list on the left shows all requests and the distribution of request response times, with the red color representing failed requests. On the right, Number of requests represents the number of concurrent users, as well as the number of requests for each request and their success and failure status.
These ranges can be configured in the gatling.conf file
Summary
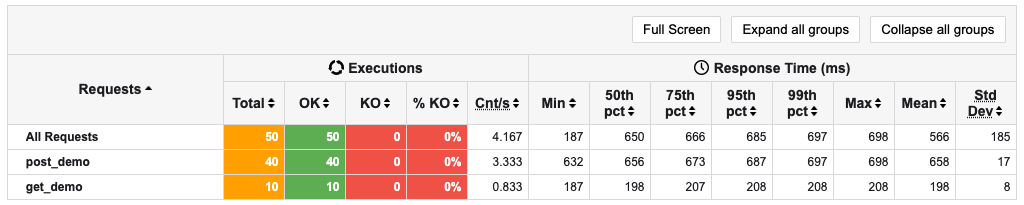
This chart shows some standard statistics such as minimum, maximum, average, standard deviation and percentile for global and per request. stats shows the specific success and failure of all requests OK for success, KO for failure, and 99th pct for 99th percentile response time for total requests for this API.
These percentiles can be configured in the gatling.conf file.
Active users over time
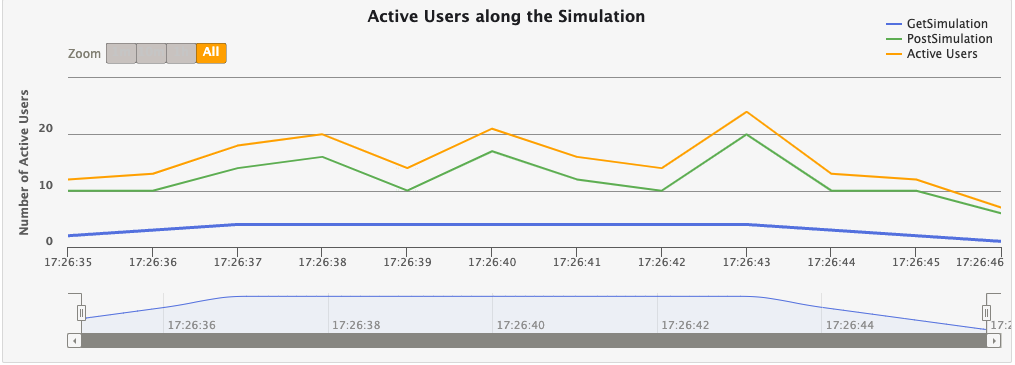
This chart shows that the number of active users refers to the number of users who are making requests during the test time period. At the beginning of the test, the number of active users is 0. When users start sending requests, the number of active users starts to increase. When a user completes a request, the number of active users begins to decrease. The maximum number of active users is the number of users sending requests at the same time during the test period.
Response time distribution
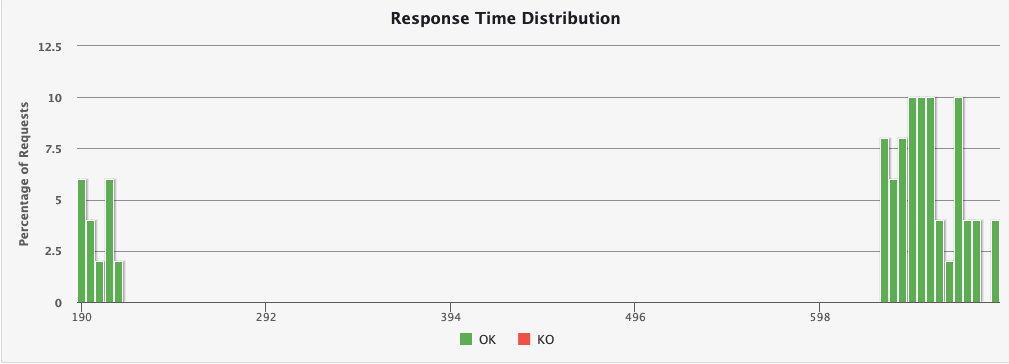
This chart shows the distribution of response times, including response times for successful requests and response times for failed requests.
Response time percentiles over time
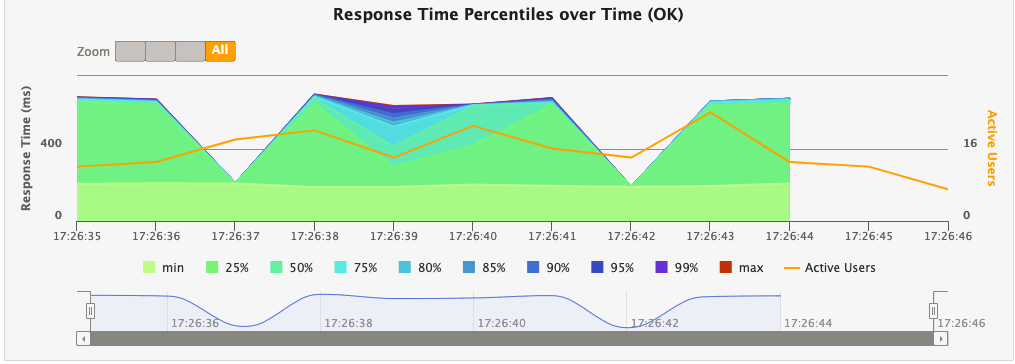
This chart shows various response time percentiles over time, but only for successful requests. Since failed requests may end early or be caused by timeouts, they can have a huge impact on the percentile calculation.
Requests per second over time
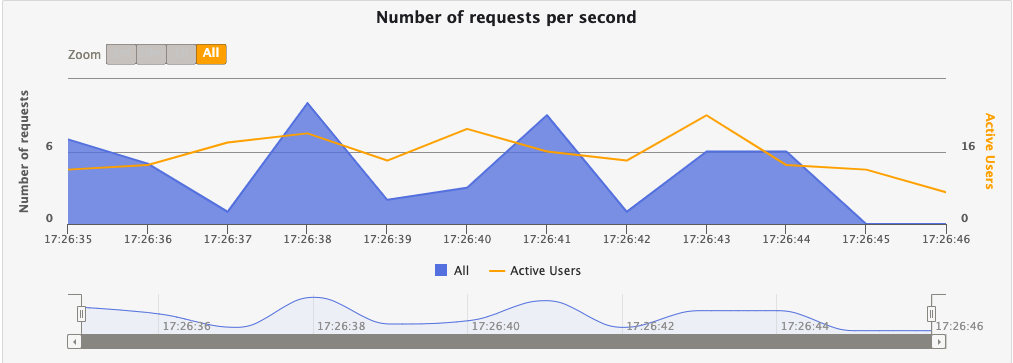
This chart shows the number of requests per second, including the number of successful requests and the number of failed requests.
Response per second over time
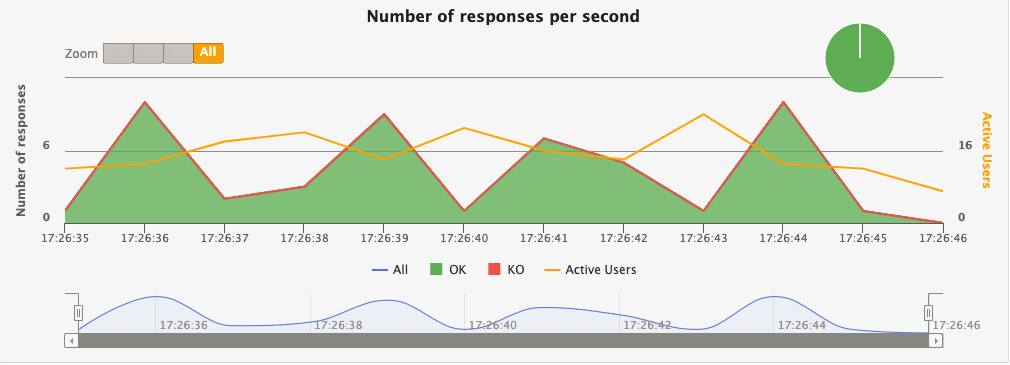
This chart shows the number of responses per second, including the number of successful responses and the number of failed responses.
Single request analysis report
You can click the details menu on the report page to switch to the details tab and view a detailed report for a single request.
The Details page primarily shows per-request statistics, and similarly to the global report includes a graph of response time distribution, response time percentile, requests per second, and responses per second. The difference is that there is a graph at the bottom that depicts the response time of a single request relative to all requests globally. The horizontal coordinate of this graph is the number of all requests per second globally, and the vertical coordinate is the response time of a single request.
Performance Scenario Setting
Injection
What is Injection
In Gatling performance testing, “Injection” refers to a method of introducing virtual users (or load) into the system. It defines how simulated users are introduced into a test scenario, including the number, rate, and manner of users.Injection is a key concept used in Gatling to control load and concurrency, allowing you to simulate different user behaviors and load models.
User injection profiles are defined using the injectOpen and injectClosed methods (inject in Scala). This method takes as arguments a sequence of injection steps that are processed sequentially. Each step defines a set of users and how these users are injected into the scene.
More from the web site: https://gatling.io/docs/gatling/reference/current/core/injection/
Common Injection Scenario
Open Model Scenario
setUp(
  scn.inject(
    nothingFor(4), // 1
    atOnceUsers(10), // 2
    rampUsers(10).during(5), // 3
    constantUsersPerSec(20).during(15), // 4
    constantUsersPerSec(20).during(15).randomized, // 5
    rampUsersPerSec(10).to(20).during(10.minutes), // 6
    rampUsersPerSec(10).to(20).during(10.minutes).randomized, // 7
    stressPeakUsers(1000).during(20) // 8
  ).protocols(httpProtocol)
)
- nothingFor(duration): set a period of time to stop, this time to do nothing
- atOnceUsers(nbUsers): immediately inject a certain number of virtual users
- rampUsers(nbUsers) during(duration): set a certain number of virtual users to be injected gradually during a specified period of time.
- constantUsersPerSec(rate) during(duration): Define a constant number of concurrent users per second for a specified period of time.
- constantUsersPerSec(rate) during(duration) randomized: defines a randomized concurrency increase/decrease around a specified number of concurrencies per second, for a specified period of time
- rampUsersPerSec(rate1) to (rate2) during(duration): defines a concurrency interval that runs for the specified time, with the concurrency growth period being a regular value.
- rampUsersPerSec(rate1) to (rate2) during(duration) randomized: define a concurrency interval, run for a specified time, the concurrency growth period is a random value
- stressPeakUsers(nbUsers).during(duration) : injects a given number of users according to a smooth approximation of a step function that stretches to a given duration. users.
Closed Model Scenario
setUp(
  scn.inject(
    constantConcurrentUsers(10).during(10), // 1
    rampConcurrentUsers(10).to(20).during(10) // 2
  )
)
- constantConcurrentUsers(fromNbUsers).during(duration) : inject to make the number of concurrent users in the system constant
- rampConcurrentUsers(fromNbUsers).to(toNbUsers).during(duration) : inject so that the number of concurrent users in the system increases linearly from one number to the next
Meta DSL Scenario
“Meta DSL is a special Domain Specific Language (DSL) for describing the metadata and global configuration of performance test scenarios.Meta DSL allows you to define a number of global settings and parameters in a performance test that affect the entire test process, rather than being specific to a particular scenario.
The elements of the Meta DSL can be used to write tests in a simpler way. If you want to link levels and ramps to reach the limits of your application (a test sometimes referred to as a capacity load test), you can do this manually using the regular DSL and looping with map and flatMap.
- incrementUsersPerSec
setUp(
  // Generate an open workload injection profile
  // 10, 15, 20, 25 and 30 users arrive every second
  // Each level lasts 10 seconds
  // Each level lasts 10 seconds
  scn.inject(
    incrementUsersPerSec(5.0)
      .times(5)
      .eachLevelLasting(10)
      .separatedByRampsLasting(10)
      .startingFrom(10) // Double
  )
- incrementConcurrentUsers
setUp(
  // Generate a closed workload injection profile
  // Concurrent users at levels 10, 15, 20, 25, and 30
  // Each level lasts 10 seconds
  // Each level lasts 10 seconds
  scn.inject(
    incrementConcurrentUsers(5)
      .times(5)
      .eachLevelLasting(10)
      .separatedByRampsLasting(10)
      .startingFrom(10) // Int
  )
)
incrementUsersPerSec is used for open workloads, incrementConcurrentUsers is used for closed workloads (users/sec vs concurrent users).
separatedByRampsLasting and startingFrom are both optional. If you do not specify a ramp, the test jumps from one level to another as soon as it finishes. If you do not specify the number of starting users, the test will start with 0 concurrent users or 0 users per second and move to the next step immediately.
Concurrent Scenario
setUp(
  scenario1.inject(injectionProfile1),
  scenario2.inject(injectionProfile2)
)
You can configure multiple scenes to start simultaneously and execute concurrently in the same setUp block.
Other Scenarios
Check out the website: https://gatling.io/docs/gatling/reference/current/core/injection/