K6 common function
HTTP Requests
The first step in performance testing with K6 is to define the HTTP requests to be tested.
GET Request Example
A simple HTTP request for the GET method is already included in the demo test script created with the k6 new command:
import http from 'k6/http';
import { sleep } from 'k6';

export default function() {
  http.get('https://test.k6.io');
  sleep(1);
}
POST Request Example
This POST request example shows the application of some complex scenarios (POST request with email/password authentication load)
import http from 'k6/http';

export default function () {
  const url = 'http://test.k6.io/login';
  const payload = JSON.stringify({
    email: 'aaa',
    password: 'bbb',
  });

  const params = {
    headers: {
      'Content-Type': 'application/json',
    },
  };

  http.post(url, payload, params);
}
The above is taken from K6 Official Documentation
Supported HTTP Methods
The HTTP module provided by K6 can handle various HTTP requests and methods. The following is a list of supported HTTP methods:
| NAME | VALUE |
|---|---|
| batch() | makes multiple HTTP requests in parallel (like e.g. browsers tend to do). |
| del() | makes an HTTP DELETE request. |
| get() | makes an HTTP GET request. |
| head() | makes an HTTP HEAD request. |
| options() | makes an HTTP OPTIONS request. |
| patch() | makes an HTTP PATCH request. |
| post() | makes an HTTP POST request. |
| put() | makes an HTTP PUT request. |
| request() | makes any type of HTTP request. |
HTTP Request Tags
K6 allows you to add tags to each HTTP request. Combining tags and grouping makes it easy to better organize in test results, group requests and filter results to organize analysis.
The following is a list of supported tags:
| NAME | DESCRIPTION |
|---|---|
| expected_response | By default, response statuses between 200 and 399 are true. Change the default behavior with setResponseCallback. |
| group | When the request runs inside a group, the tag value is the group name. Default is empty. |
| name | Defaults to URL requested |
| method | Request method (GET, POST, PUT etc.) |
| scenario | When the request runs inside a scenario, the tag value is the scenario name. Default is default. |
| status | response status |
| url | defaults to URL requested |
Examples of HTTP requests using tag and group tags will be shown in subsequent demos.
You can also refer to the official examples:https://grafana.com/docs/k6/latest/using-k6/http-requests/
Metrics
The metrics are used to measure the performance of the system under test conditions. By default, k6 automatically collects built-in metrics. In addition to the built-in metrics, you can create custom metrics.
Metrics generally fall into four categories:
- Counters: Summing values.
- Gauges: Tracking the smallest, largest, and most recent values.
- Rates: Tracking how often non-zero values occur.
- Trends: Calculating statistical information (such as mean, mode, or percentile) for multiple values.
To ensure that test assertions meet the criteria, thresholds can be written based on the conditions of the metrics required by the performance test (the specifics of the expression depend on the type of metric).
For subsequent filtering of metrics, labels and groupings can be used, allowing for better organization of test results.
The test results output file can export metrics in a variety of summary and fine-grained formats. For more information, refer to the results output documentation. (This section will be covered in more detail in the later part of the test results output documentation.)
K6 Built-in Metrics
Every k6 test execution emits both built-in and custom metrics. Each supported protocol also has its specific metrics.
Standard Built-in Metrics
Regardless of the protocol used in the test, k6 always collects the following metrics:
| Metric Name | Type | Description |
|---|---|---|
| vus | Gauge | Current number of active virtual users |
| vus_max | Gauge | Max possible number of virtual users (VU resources are pre-allocated, to avoid affecting performance when scaling up load ) |
| iterations | Counter | The aggregate number of times the VUs execute the JS script (the default function). |
| iteration_duration | Trend | The time to complete one full iteration, including time spent in setup and teardown. To calculate the duration of the iteration’s function for the specific scenario, try this workaround |
| dropped_iterations | Counter | The number of iterations that weren’t started due to lack of VUs (for the arrival-rate executors) or lack of time (expired maxDuration in the iteration-based executors). About dropped iterations |
| data_received | Counter | The amount of received data. This example covers how to track data for an individual URL. |
| data_sent | Counter | The amount of data sent. Track data for an individual URL to track data for an individual URL. |
| checks | Rate | The rate of successful checks. |
HTTP-specific built-in metrics
HTTP-specific built-in metrics are generated only when the test makes HTTP requests.Other types of requests, such as WebSocket, do not generate these metrics.
Note: For all http_req_* metrics, the timestamp is emitted at the end of the request. In other words, the timestamp occurs when k6 receives the end of the response body or when the request times out.
The following table lists HTTP-specific built-in metrics:
| Metric Name | Type | Description |
|---|---|---|
| http_reqs | Counter | How many total HTTP requests k6 generated. |
| http_req_blocked | Trend | Time spent blocked (waiting for a free TCP connection slot) before initiating the request. float |
| http_req_connecting | Trend | Time spent establishing TCP connection to the remote host. float |
| http_req_tls_handshaking | Trend | Time spent handshaking TLS session with remote host |
| http_req_sending | Trend | Time spent sending data to the remote host. float |
| http_req_waiting | Trend | Time spent waiting for response from remote host (a.k.a. “time to first byte”, or “TTFB”). float |
| http_req_receiving | Trend | Time spent receiving response data from the remote host. float |
| http_req_duration | Trend | Total time for the request. It’s equal to http_req_sending + http_req_waiting + http_req_receiving (i.e. how long did the remote server take to process the request and respond, without the initial DNS lookup/connection times). float |
| http_req_failed | Rate | The rate of failed requests according to setResponseCallback. |
Other built-in metrics
In addition to the standard built-in metrics and HTTP-specific built-in metrics, K6 built-in metrics also have other built-in metrics:
- Browser metrics : https://grafana.com/docs/k6/latest/using-k6/metrics/reference/#browser
- Built-in WebSocket metrics : https://grafana.com/docs/k6/latest/using-k6/metrics/reference/#websockets
- Built-in gRPC metrics : https://grafana.com/docs/k6/latest/using-k6/metrics/reference/#grpc
custom metrics
Besides the built-in metrics, you can create custom metrics. For example, you can compute a metric for your business logic, or use the Response.timings object to create a metric for a specific set of endpoints.
Each metric type has a constructor to create a custom metric. The constructor creates a metric object of the declared type. Each type has an add method to take metric measurements.
Note: Custom metrics must be created in the init context. This limits memory and ensures that K6 can verify that all thresholds evaluate the defined metrics.
custom metrics demo
The following example demonstrates how to create a custom trend metrics for wait time:
The demo_custom_metrics.js file in the project file already contains this demo example, which can be run directly to view the results.
1.Import the Trend constructor from the k6/metrics module
import { Trend } from 'k6/metrics';
The waiting time trend metrics is a Trends metrics, so the Trend constructor needs to be introduced from the k6/metrics module.
2.Constructs a new custom metric Trend object in the init context
const myTrend = new Trend('waiting_time');
Construct a new custom metric Trend object in the init context, the object in the script is myTrend, and its metric is displayed as
waiting_timein the resulting output.
3.Use the add method in a script to record metric measurements
export default function() {
  const res = http.get('https://test.k6.io');
  myTrend.add(res.timings.waiting);
}
Use the add method in the script to record the metric measurement values. Here,
res.timings.waitingis used, which is the waiting time.
4.demo_custom_metrics.js Complete code of custom metric
import http from 'k6/http';
import { Trend } from 'k6/metrics';

const myTrend = new Trend('waiting_time');

export default function () {
  const res = http.get('https://httpbin.test.k6.io');
  myTrend.add(res.timings.waiting);
  console.log(myTrend.name); // waiting_time
}
5.Run demo_custom_metrics.js and view automated trending metrics
k6 run demo_custom_metrics.js
The running results are as follows:
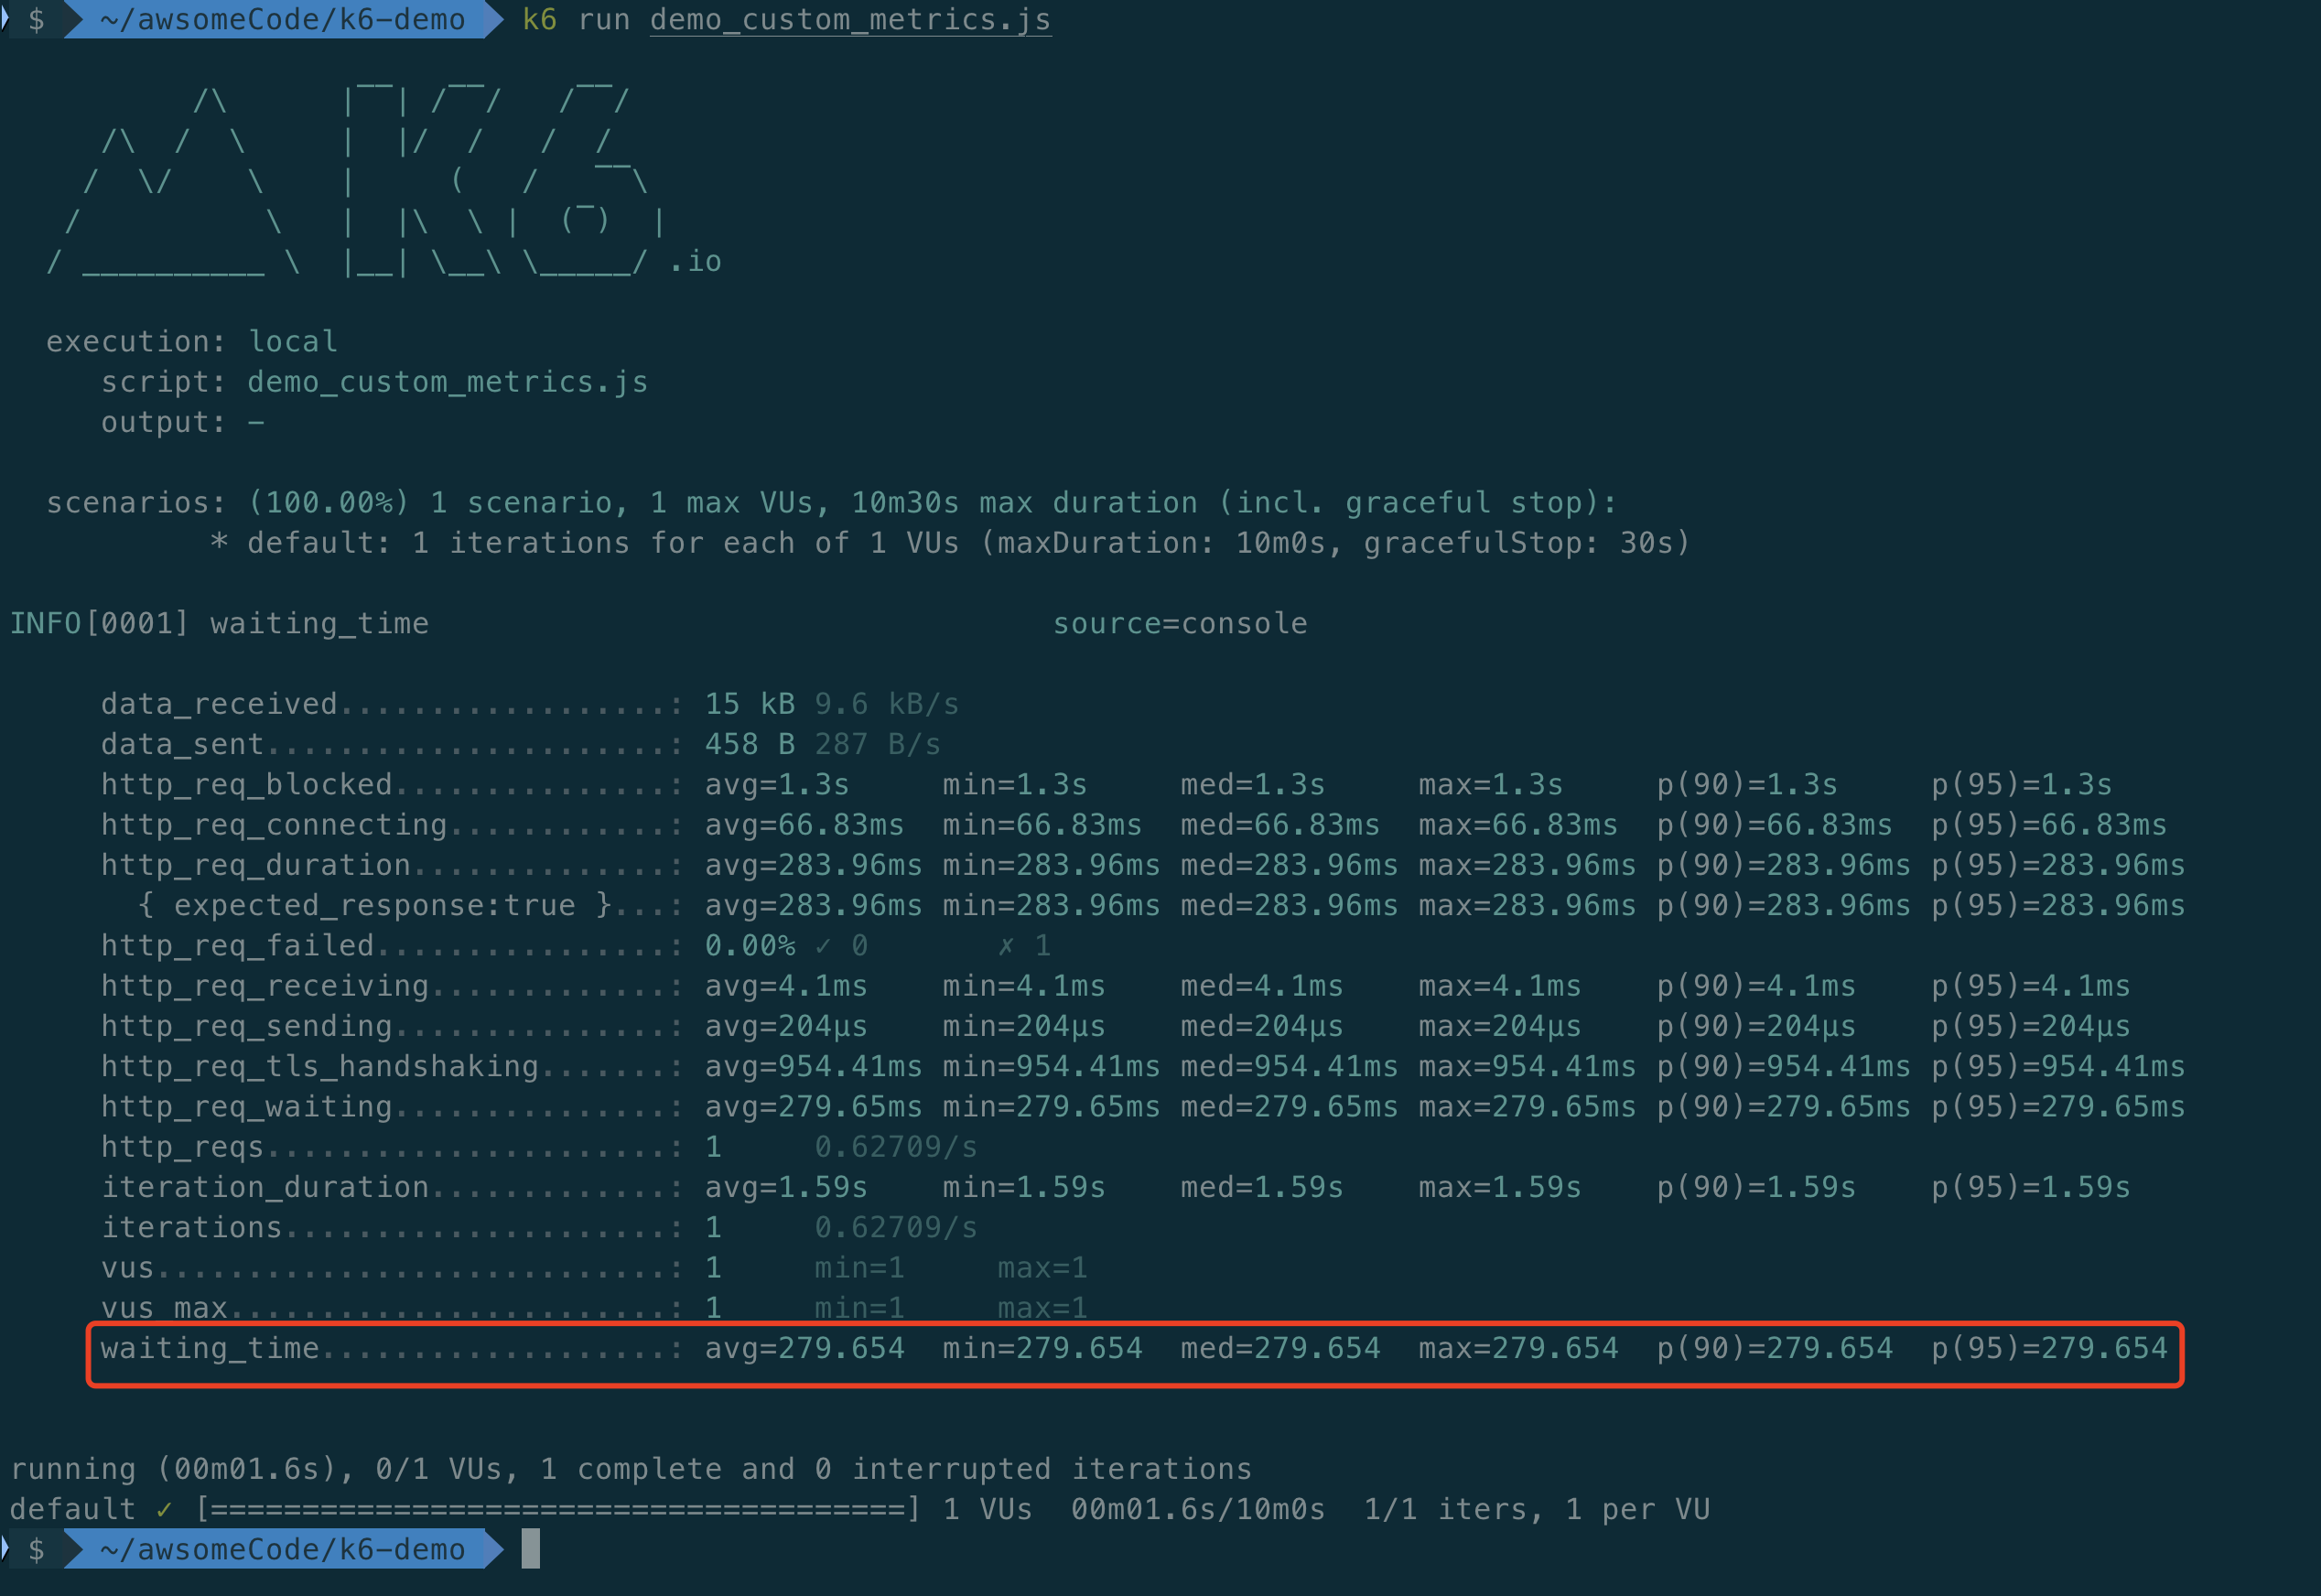
As you can see, the custom metric
waiting_timehas been displayed in the result output.
For more information about custom metrics, please refer to the official documentation: https://k6.io/docs/using-k6/metrics/#custom-metrics
Checks
This can also be understood as assertions, which verify the test results.
Checks are used to verify whether specific test conditions in different tests are correctly responded to, similar to how we conventionally verify test results in other types of tests to ensure that the system responds as expected.
For example, a check can ensure that the response status of a POST request is 201, or that the size of the response body matches expectations.
Checks are similar to the concept of assertions in many testing frameworks, but K6 does not abort the test or end it in a failed state when verifications fail. Instead, k6 tracks the failure rate of failed verifications as the test continues to run.
Each check creates a rate metric. To make a check abort or cause the test to fail, it can be combined with thresholds.
Below, we will introduce how to use different types of checks and how to view check results in test results.
1. Check HTTP Response Status
K6 checks are particularly useful for response assertions related to HTTP requests.
For example, the following code snippet checks that the HTTP response code is 200:
import { check } from 'k6';
import http from 'k6/http';

export default function () {
  const res = http.get('https://httpbin.test.k6.io');
  check(res, {
    'HTTP response code is status 200': (r) => r.status === 200,
  });
}
Running this script, you can see the following results:
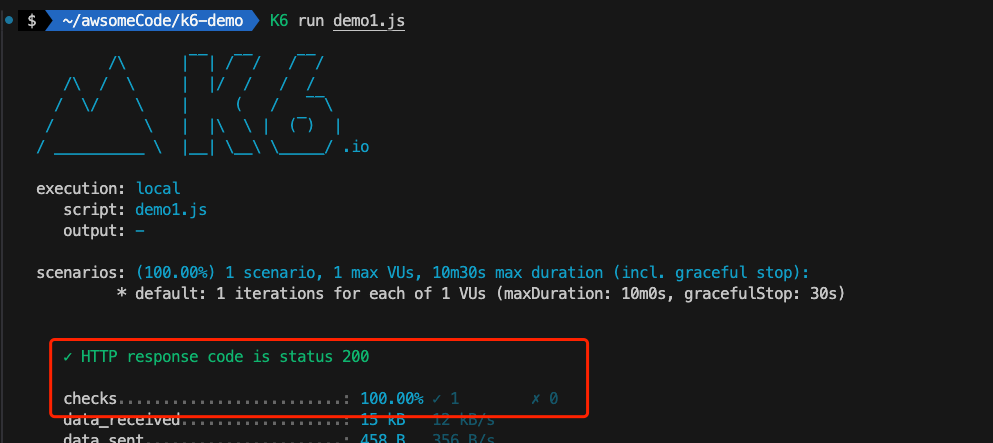
When a script contains checks, the summary report shows how many test checks have passed.
In this example, note that the check “HTTP response code is status 200” is 100% successful when called.
2. Check HTTP Response Body
In addition to checking the HTTP response status, you can also check the HTTP response body.
For example, the following code snippet checks that the HTTP response body size is 9591 bytes:
import { check } from 'k6';
import http from 'k6/http';

export default function () {
  const res = http.get('https://httpbin.test.k6.io');
  check(res, {
    'HTTP response body size is 9591 bytes': (r) => r.body.length == 9591,
  });
}
Running this script, you can see the following results:
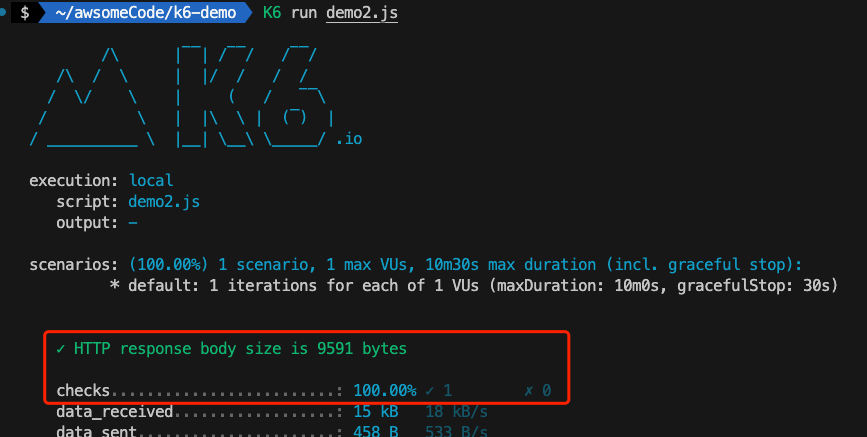
When a script contains checks, the summary report shows how many test checks have passed.
In this example, note that the check “HTTP response body size is 9591 bytes” is 100% successful when called.
3. Adding Multiple Checks
Sometimes, multiple checks need to be added in a single test script. You can directly add multiple checks in a single check() statement, as shown in the script below:
import { check } from 'k6';
import http from 'k6/http';

export default function () {
  const res = http.get('https://httpbin.test.k6.io');
  check(res, {
    'HTTP response code is status 200': (r) => r.status === 200,
    'HTTP response body size is 9591 bytes': (r) => r.body.length == 9591,
  });
}
Running this script, you can see the following results:
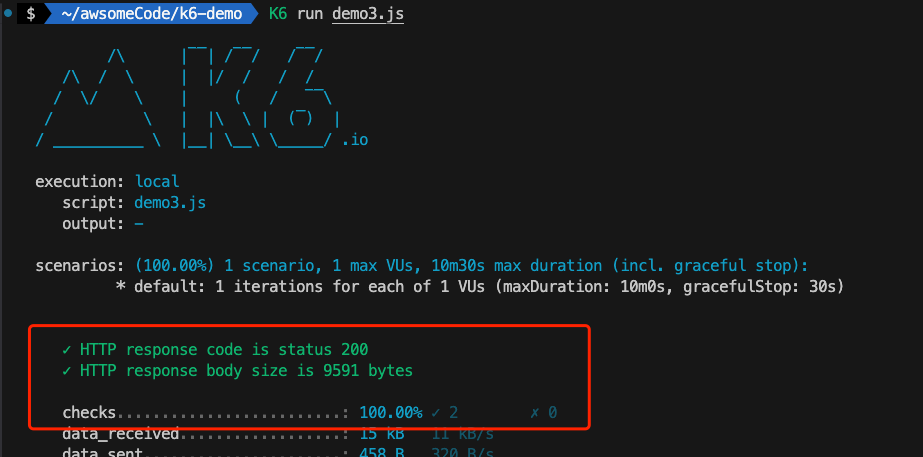
In this example, both checks pass successfully (the call is 100% successful).
Note: When a check fails, the script will continue to execute successfully and will not return a “failed” exit status. If you need to fail the entire test based on check results, you must combine checks with thresholds. This is particularly useful in specific environments, such as integrating k6 into a CI pipeline or receiving alerts when scheduling performance tests.